This is the stack visualizer. When you debug your program with gdb and you want to imagine what goes on on the stack you can use the stack visualizer.
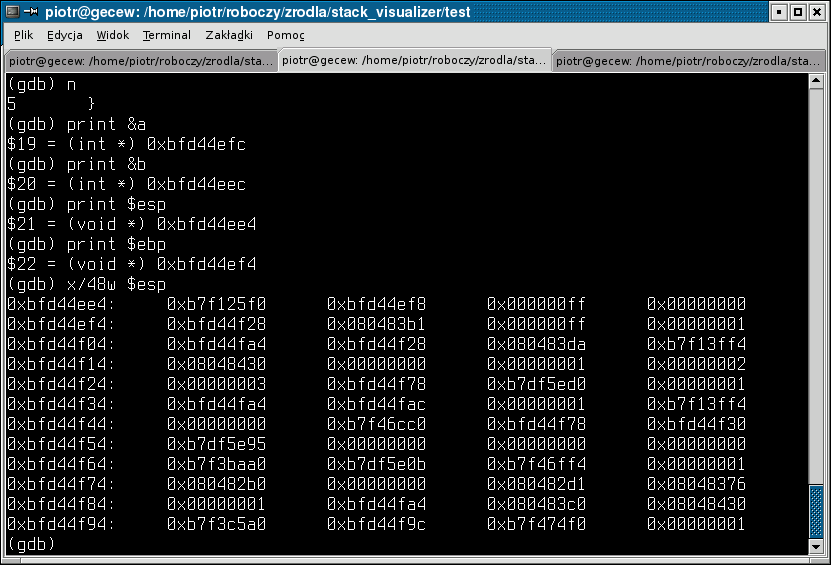
In order to use it, you have to issue in gdb that three commands:
print $esp
print $ebp
x/48w $esp
Then you have to paste the output in the space below and click submit.
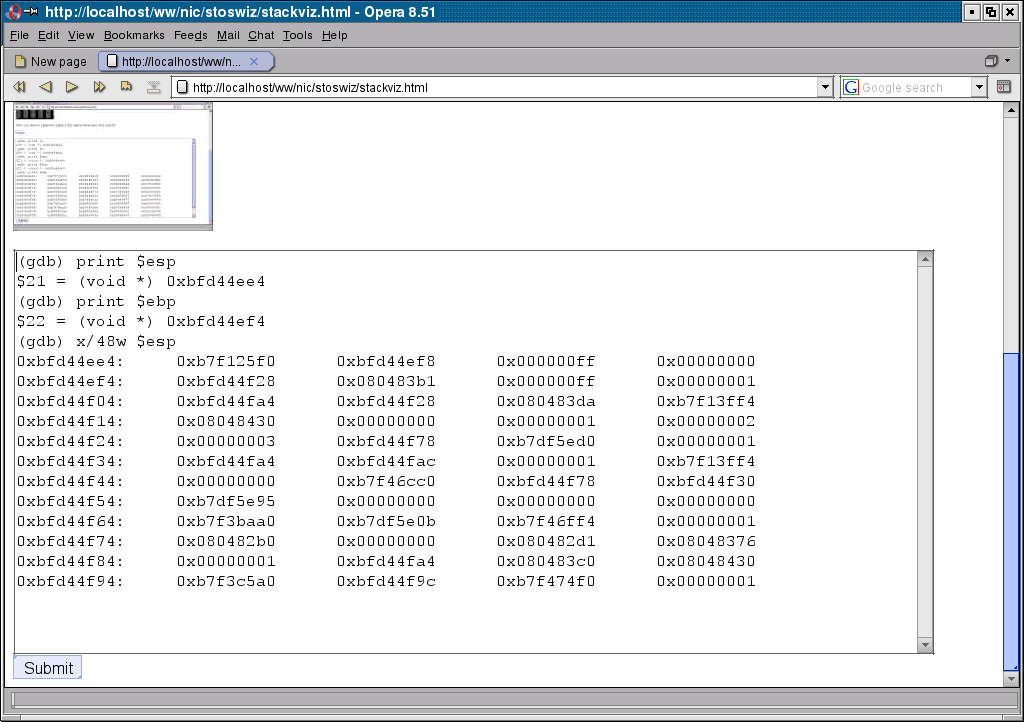
Then the stack visualizer will parse gdb's output and will show you how the stack looks like in this moment.
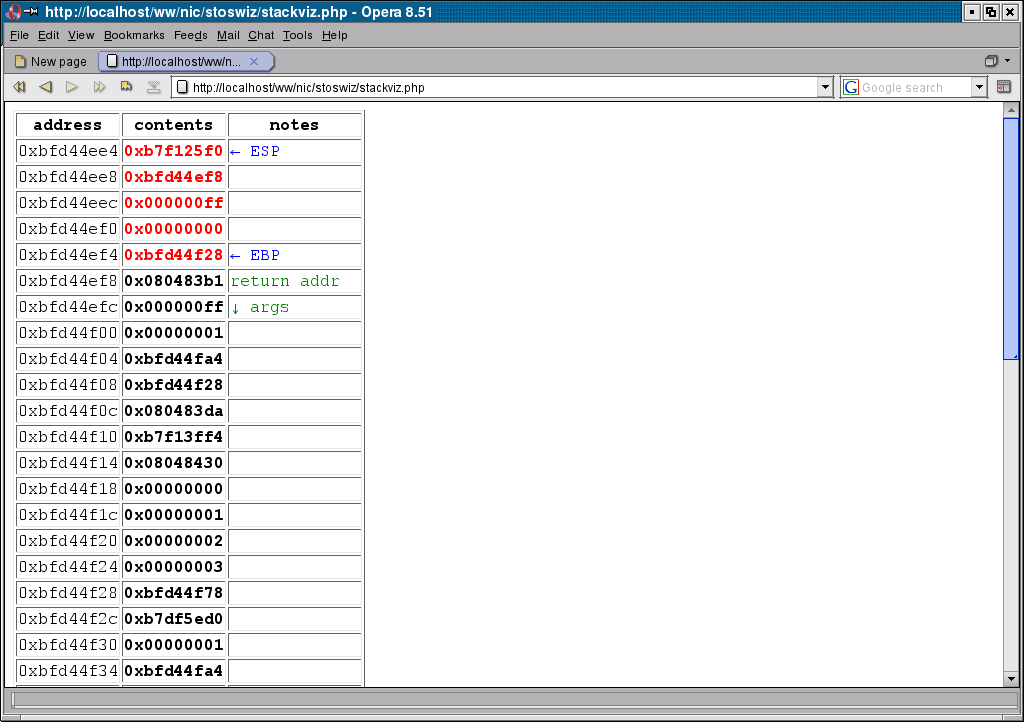
If you issue not only that three magic commands, but also something like:
print &<some_variable>
the stack visualizer will know what is the address of this variable and will show you where it lies on the stack. Of course you can do this with more variables.
This tool was written by me. You can download it here. It is an open source released under GPL.